


Sync with Google BigQuery and leverage Grafana for powerful reporting.
Version 20 Update 6 BETA heralds a major step forward in call reporting. Building upon the new reports recently introduced, you can now sync 3CX with Google BigQuery and leverage Grafana for all kinds of reporting, dashboarding and visualisation capabilities! Stored separately from your instance – with more features than before – management is easy. Best of all – make your own reports using the Google and Grafana free tiers and say goodbye to expensive add on products. Available for PRO licenses 8SC and up, read on for more.
Dashboard Overview
Queues
Store Call Logs Off Your 3CX Phone System
This update lets you store call logs for reporting off your 3CX phone system. Sync your full Call Data History and export and purge as needed. Enjoy much faster back up and restore!
Use the setup guides for Google BigQuery and AWS PostgreSQL to get started.
Important: 3CX will only transfer and sync new call logs. For legacy call logs this will not apply.
Grafana Custom Reports & Dashboard with Google BigQuery
Update 6 includes the ability to connect your 3CX system to an external data source, such as Google BigQuery or PostgreSQL, and then link it to Grafana for custom reports and dashboards. No paid add-ons – just flexible, in-depth reporting that’s easier to manage.
On the Grafana dashboard you’ll find some built in reports – but you can also make your own.
Getting Started with 3CX Grafana Dashboards
- Create a Free Grafana Cloud account or self-hosted
- Follow the steps documented in Grafana BigQuery setup guide
- In Grafana, go to the left sidebar → Dashboards → New → Import
- Download the 3CX Grafana Templates and unzip the archive. You’ll find:
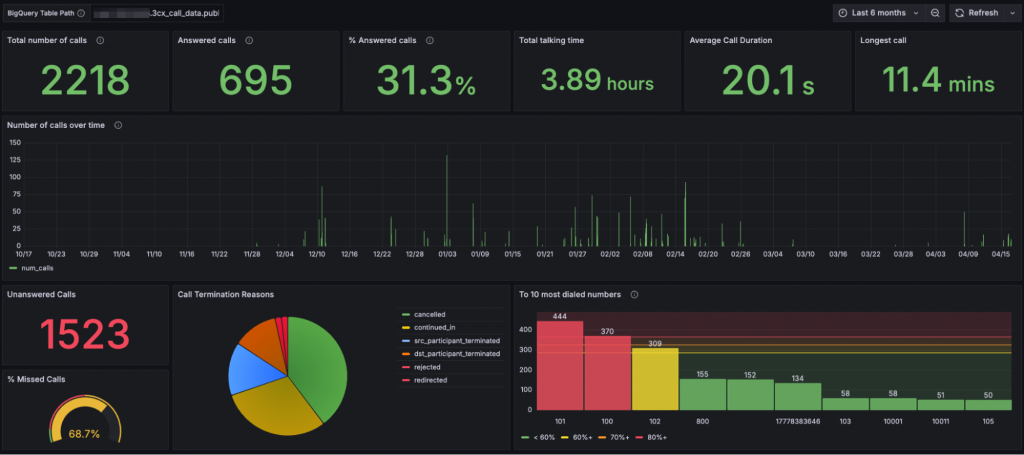
- 3cxcalldashboard.json – Provides a high-level overview of total call activity, answered/missed breakdowns, and key call duration metrics.
- Queuereport.json – Offers detailed analytics on queue performance, including answered rates, wait times, and agent engagement.
- Ringgroupreport.json – Displays call metrics specific to ring groups, helping monitor distribution and response effectiveness across teams.
- Click upload JSON file and upload each dashboard individually
- Click “Load”
- Once loaded, Grafana will prompt to “Select a data source”. Choose the pre-configured datasource “grafana-bigquery-datasource” from the dropdown.
- At the top of each dashboard there is a textbox called “BigQuery Table Path”. Set it to your BigQuery table path like: pbx-12345678.3cx_call_data.public_cdroutput
- Click Save and you’re ready to explore your 3CX call data
Other Features
- PKCE Support applies to Salesforce, Zendesk, Zoho and Dynamics 365.
- User Operation rights extended to include viewing and changing another user’s call forwarding settings.
- Multi-tenant company switch to run 3CX as either a single-tenant or multi-tenant system. Available for licenses with 16+ SC
View the complete change log here.
Want to explore the BETA?
- Log in to the Admin Console
- Go to System > Updates
- Select Update 6 BETA and click Download
Reminder: This version is for testing only. Do not install on production systems.
Join the conversation in our dedicated Partner or Customer Forums. Follow us on X and LinkedIn to stay-up-to date on latest news and feature releases.
Source link

Other Articles
Introducing RTCP: The RTP Control Protocol

No Comment! Be the first one.