
When it comes to maintaining high-quality calling experiences for your users in Microsoft Teams, the Call Quality Dashboard (CQD) is an indispensable tool for IT admins. We’ve been listening to your feedback, and over the last year, we developed, trained, and published intelligent media quality classifiers to CQD, adding a new layer of analysis that helps Teams admins identify the root causes of their call quality issues. During that time, we also spent considerable effort integrating these new classifiers into our most popular tool for admins who use the call quality connector via Power BI Desktop: the Quality of Experience Report (QER), which is now at v5.0.
Table of Contents
ToggleWhat do intelligent media quality classifiers do?
Intelligent media quality classifiers are advanced tools within CQD that use machine learning algorithms to analyze the quality of audio, video, and video-based screen sharing (VBSS) streams. Legacy stream classifiers relied upon simple conditional statements and thresholds to identify good and poor streams. Intelligent media quality classifiers offer a more nuanced view of call telemetry. They don’t just identify good or poor streams, they go deeper to identify the underlying issues affecting the quality of the call.
How do they work?
These classifiers take a multi-faceted approach to evaluate call quality. They consider various factors, such as network performance, device capabilities, and input devices.
Imagine a user – we’ll call him James (because that’s my name) – opens a ticket about poor audio quality in a recent Teams meeting organized by Victor, reporting that the meeting audio was bad. Our first instincts might be to start looking immediately at James’ call telemetry, laptop, network, etc. and start troubleshooting from there. James was working in the office that day; the internet connection is high bandwidth and low latency, his laptop’s network connection is wired, and the laptop has enough resources to support Teams meetings. This is the first time James has reported poor quality, and as the help desk hasn’t much to go on, the ticket is closed as ‘Unable to reproduce” after some investigation. James was reporting that he heard poor audio quality, but unbeknownst to James and the help desk, he was hearing Victor’s poor network connection. The intelligent media quality classifiers can help here.
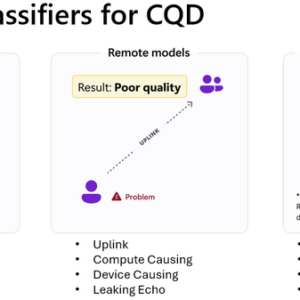
The classifiers are segmented into local and remote categories. Local classifiers look at the user’s own environment, while remote classifiers examine the impact of other participants in the call.
In our simplified example, we would look at the intelligent media quality classifiers across all the participants in the meeting, and we would see that Victor would be marked as dominant user (based on how much speaking was being done by Victor during the meeting).
|
|
Detected Media Modality Problem |
Is Dominant Participant |
Detected Uplink Problem |
Detected Other User Uplink Problem |
|
James |
1 |
0 |
0 |
1 |
|
Victor |
1 |
1 |
1 |
0 |
|
Siunie |
1 |
0 |
0 |
1 |
Our users all have the Media Modality local model show as true, and the Other User Uplink model will show as true for James and Siunie, indicating that the problem was with another user. Siunie heard Victor’s poor audio too, but she didn’t report anything. We can then look at Victor and see that there was a problem with the network uplink on Victor’s end. We have now established the source of the quality issue and narrowed our scope of investigation to look at Victor’s network setup. By looking at Victor’s telemetry across other calls he has been a part of, we can investigate further to understand if this is a common occurrence with his network.
While the problem in this example is clear and easy to figure out, troubleshooting call quality isn’t always so straightforward, and problems can have multiple contributing factors. The intelligent media quality classifiers will flag any model as true where there is a high probability it contributed to the poor call experience.
How will these be made available in the new QER v5.0?
Through conversations with customers and Microsoft engineers, we’ve considered how customers use the QER, what reports are most heavily relied upon, and what we felt could provide the biggest impact to admins looking for ways to improve quality. Where reports previously relied upon the legacy classifiers, we’ve put the new intelligent classifiers in their place, reducing false positives and red herrings in your troubleshooting, while providing potential root cause analysis to reduce time spent digging through the data.
What’s new in QER v5.0?
Version 5.0 of the popular Quality of Experience Report (QER) has our new intelligent media quality classifiers added into the reports that admins already know and rely on today, a freshly updated look, a new way to provide feedback to the CQD Product Group, and some brand-new reports to incorporate the new experiences we’re offering our Teams customers, such as Teams Live Events, Town Halls and new Teams optimizations for VDI. You’ll want to download it here.
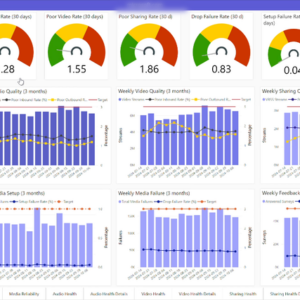
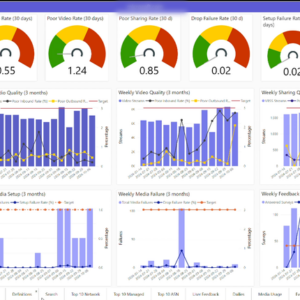
One of the heavily used reports in the QER is the Media Health report. As and admin you want to get a quick glance into the overall health of Teams media in your environment. And this report now has been updated to use the new intelligent media quality classifiers and better reflect the experience of your users.
Figure 1. Media Health report
Once you have uploaded a building data file, you can filter the reports to a specific building or network and show the quality indicators associated with that particular location. If you don’t have a building data file yet, you can still use the filters to look at specific ISPs and countries.
We always recommend that customers using Teams prepare a Building Data file and upload it to CQD, and if you need assistance doing so, we provide guidance and tools to do just that.
Figure 2. Media Health report
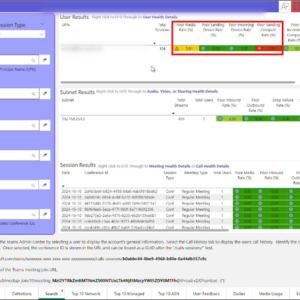
When you need to investigate a media quality issue the updated Search page allows you to look for a specific user, a network location, specific meetings, and more. When you perform a search, you’ll get information directly on the search page so you can identify what’s impacting the user. The new intelligent media classifiers not only look at the average values for the network metrics, but now also takes into account device specific issues.
In this case, the majority of issues for this user are associated with the devices the user is using to join the Teams meeting. The Compute device classifier detects issues associated with high CPU or memory usage on the user device.
Figure 3. Search experience
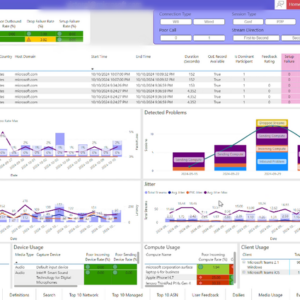
If you’re interested in finding out more about the experience of that user, you can drill-down to the specific user using the User Health Details report and get access to detailed information about their calls and any quality markers that may indicate problems during a meeting. The detected problems graph shows the issues associated with this user over time, confirming that quality for this user is affected mostly by problems related to the compute device:
Figure 4: Detected Problems graph– User Details Report
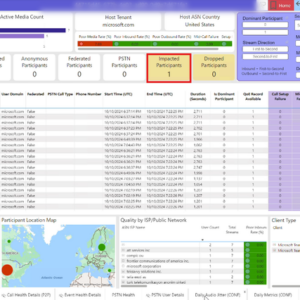
You can do the same for meetings by going to the Meeting Details report; the report will show a quality overview of the meeting and the count of users where the intelligent media quality classifiers detected issues during the meeting:
Figure 5.Meeting Details report – Impacted Participants
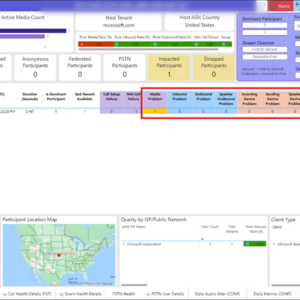
Using the filters provided, you can focus on just the streams where quality issues were detected. The new intelligent media quality classifiers can help identify the cause of the problem; in this example, sending compute issue was detected, meaning that problems related to the end user device impacted the experience of other users in the meeting.
Figure 6. Meeting Details report – Detected media problems
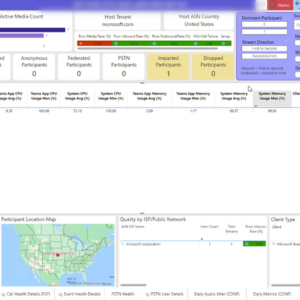
In the same report, you can scroll to the left to see the detailed performance metrics, which can help identify the root cause of the problem. In this case the user device experienced very high system CPU and memory utilization causing problems on the outbound video quality.
Figure 7. Meeting Dettails Report – Resource utilization
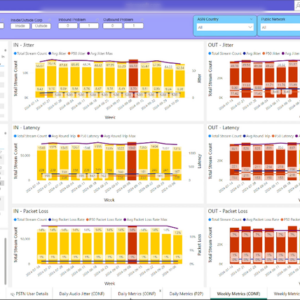
If you need to troubleshoot complex network issues the Network Metrics (daily or weekly) reports have been enhanced dynamic coloring based on the new classifiers to show the specific networks, countries and dates where quality is affected.
Figure 8.QER Weekly Network Metrics
We welcome your feedback on your experience with QER. You can now use the feedback link on each report to share your input, which will help inform future directions for QER.
Conclusion
There’s plenty to talk about with the new intelligent media quality classifiers in CQD and the latest QER v5.0, but the best way to get familiar with them is to start using them in your environment today. Together, they represent a powerful addition to your toolkit for managing call quality in Teams. By leveraging machine learning, these classifiers provide deeper insights and more accurate diagnoses of call quality issues with fewer false positives and better root-cause. As you use these tools, you’ll be better equipped to proactively address and prevent quality problems while ensuring smooth and reliable communication across your organization.
References:
Intelligent media quality classifiers in Call Quality Dashboard (CQD)
Source link
roosho.
I am Rakib Raihan RooSho, Jack of all IT Trades. You got it right. Good for nothing. I try a lot of things and fail more than that. That's how I learn. Whenever I succeed, I note that in my cookbook. Eventually, that became my blog.


No Comment! Be the first one.